Vol90 ranks Bitcoin's recent 90-day price volatility against its entire historical distribution — high readings mean unusually turbulent conditions. Ret365 ranks the trailing 1-year return the same way — high readings mean an unusually strong run, low readings mean unusually weak performance. Neither measures valuation directly; both measure how extreme current conditions are relative to history.
The Common Idea: Percentile Ranking
Both indicators use the same underlying technique: take a rolling measurement (90-day realized volatility, or trailing 365-day return), calculate it for every day in Bitcoin's history, and then rank today's value against that entire historical distribution. The result is expressed as a percentile — a 90th-percentile reading means today's value is higher than 90% of all historical readings, regardless of what the raw number itself is.
This percentile approach solves a real problem: raw volatility and raw returns both looked very different in Bitcoin's early, thinly-traded years than they do today. Percentile ranking makes readings from vastly different market eras genuinely comparable, the same way MVRV Z-Score's standardization does for valuation.
90-Day Volatility Percentile
Vol90 measures Bitcoin's realized volatility over the trailing 90 days, then ranks it against the entire historical distribution of 90-day volatility readings.
| Percentile | Zone | Historical Interpretation |
|---|---|---|
| 0th – 25th | Calm | Unusually quiet — often mid-bull accumulation periods with steady appreciation |
| 25th – 50th | Normal | Typical historical range, no directional signal |
| 50th – 75th | Elevated | Above-median uncertainty — sharp recoveries, breakouts, early bear phases |
| 75th – 100th | Stress | Top quarter of all history — associated with major panics, crashes, and late-cycle mania |

See today's live reading on our 90D Volatility Percentile page.
365-Day Return Percentile
Ret365 measures Bitcoin's trailing 1-year return, then ranks it against every 1-year return in Bitcoin's history — a pure momentum gauge.
| Percentile | Zone | Historical Interpretation |
|---|---|---|
| 0th – 25th | Weak | Poor 1-year performance — consistent with late bear markets or deep corrections; historically among the more attractive entry windows |
| 25th – 50th | Moderate | Normal historical pace, no strong directional signal |
| 50th – 75th | Strong | Above-average performance — common in active bull markets |
| 75th – 100th | Extended | Extraordinary 1-year performance — has historically clustered near cycle peaks |
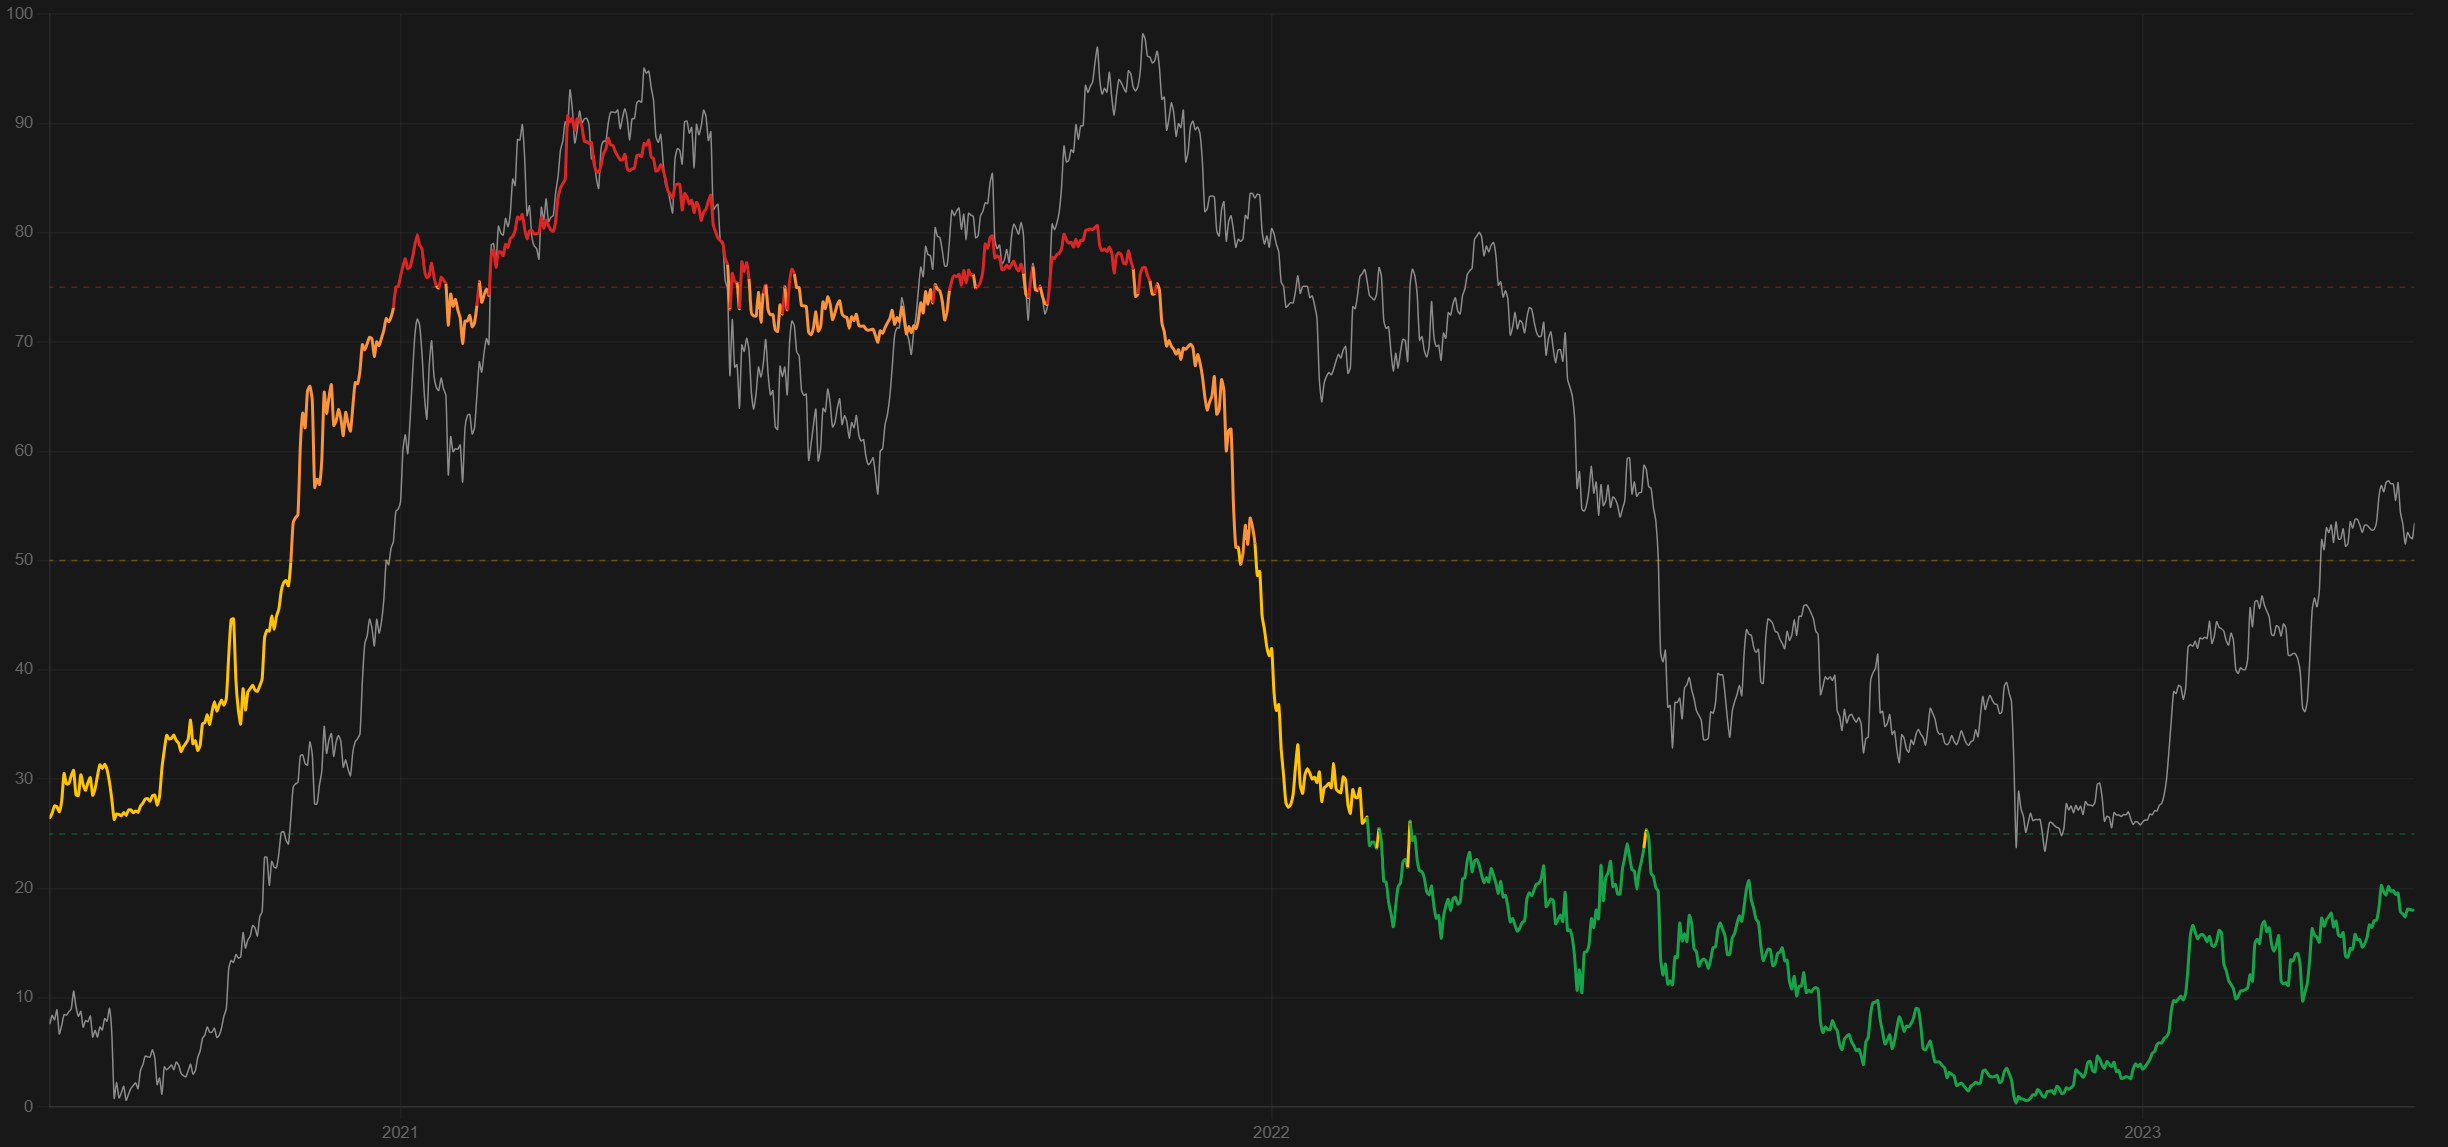
See today's live reading on our 365D Return Percentile page.
Why These Are Different from Valuation Indicators
It's worth being precise about what these two indicators are not measuring: neither one says anything directly about whether Bitcoin is cheap or expensive relative to a fair-value model. A high Ret365 reading means price has moved up a lot recently — it says nothing on its own about whether that move has run ahead of underlying fundamentals (that's what indicators like AHR999 or MVRV Z-Score are for). Similarly, high volatility can occur at both market bottoms and market tops — it signals that conditions are unusual, not which direction things are unusual in.
This makes them structurally different tools: valuation indicators answer "is this a good price," while these two answer "how extreme is what's happening right now."
Limitations
They're regime descriptors, not directional signals on their own. High volatility or extended returns describe an unusual state, not necessarily an imminent reversal.
Percentile ranking depends on the full history used. As more data accumulates, the historical distribution these percentiles are measured against continues to shift slightly, particularly for the more extreme tail readings from Bitcoin's earliest, most volatile years.
They can stay extreme for a while. A 90th-percentile volatility reading doesn't resolve quickly by definition — extreme conditions can persist for weeks.
How to Use Them Together
The most useful pattern is combining them with valuation indicators, not using them alone. A low Ret365 reading (weak trailing momentum) combined with a favourable AHR999 or MVRV reading is a genuinely different — and often more attractive — condition than either signal in isolation: it suggests price is both statistically cheap and hasn't seen a recent run that might reverse. Similarly, extreme Vol90 stress readings are worth cross-checking against NUPL or SOPR to see whether the turbulence lines up with genuine capitulation or genuine euphoria.
Both are also inputs to our Cycle Compass composite score, alongside 19 other indicators.
For a broader tour of the other major indicators worth knowing, see our guide to 10 On-Chain Bitcoin Indicators Every Investor Should Know.