The Realized Oscillator measures the log-scale distance between Bitcoin's price and its realized price. The base version uses fixed historical thresholds; the normalized version instead adapts its thresholds using a decaying expanding range, making it more responsive as Bitcoin's market matures over time.
What Is the Realized Oscillator?
Both versions of this indicator are built on the same core calculation: the natural log of current price divided by realized price — the network's estimated aggregate on-chain cost basis. That log-scale distance is the raw signal; where the two versions differ is in how they translate that raw number into a reading you can compare against history.
The Base Version: Fixed Thresholds
The base Realized Oscillator compares today's log-distance against a set of fixed historical zone boundaries, similar to how Mayer Multiple or AHR999 use fixed thresholds calibrated on past cycle extremes.
| Realized Oscillator | Zone | Historical Interpretation |
|---|---|---|
| Below 0 | Deep Value | Price below realized price — rare, often near major bear-market accumulation zones |
| 0 – 0.6 | Fair Value | Price up to ~82% above realized price — no clear extreme signal |
| 0.6 – 1.0 | Elevated | Roughly 82%–172% above realized price — significant unrealized gains building, often stronger bull-market phases |
| Above 1.0 | High Risk | More than ~172% above realized price — historically overheated cycle conditions |

The Normalized Version: Adaptive Thresholds
The normalized Realized Oscillator takes the same underlying log-distance and instead scores it against a decaying expanding range — a running record of the highest and lowest values ever seen, which very gradually "forgets" the most extreme historical outliers over time. This means its zone boundaries are not fixed constants but adapt slowly as new data comes in, keeping the indicator responsive as Bitcoin's volatility profile continues to compress with market maturity.
| Normalized Reading | Zone | Historical Interpretation |
|---|---|---|
| Below −0.5 | Deep Value | Near the lower edge of its adaptive range — heavily discounted relative to prior realized-price extremes |
| −0.5 to 0 | Fair Value | Lower half of the adaptive range — historically cheap but not at maximum washout |
| 0 to 0.5 | Elevated | Upper half of the adaptive range — historically elevated, not yet a full cycle extreme |
| Above 0.5 | High Risk | Near the top of its decayed historical range — an adaptive euphoria signal |
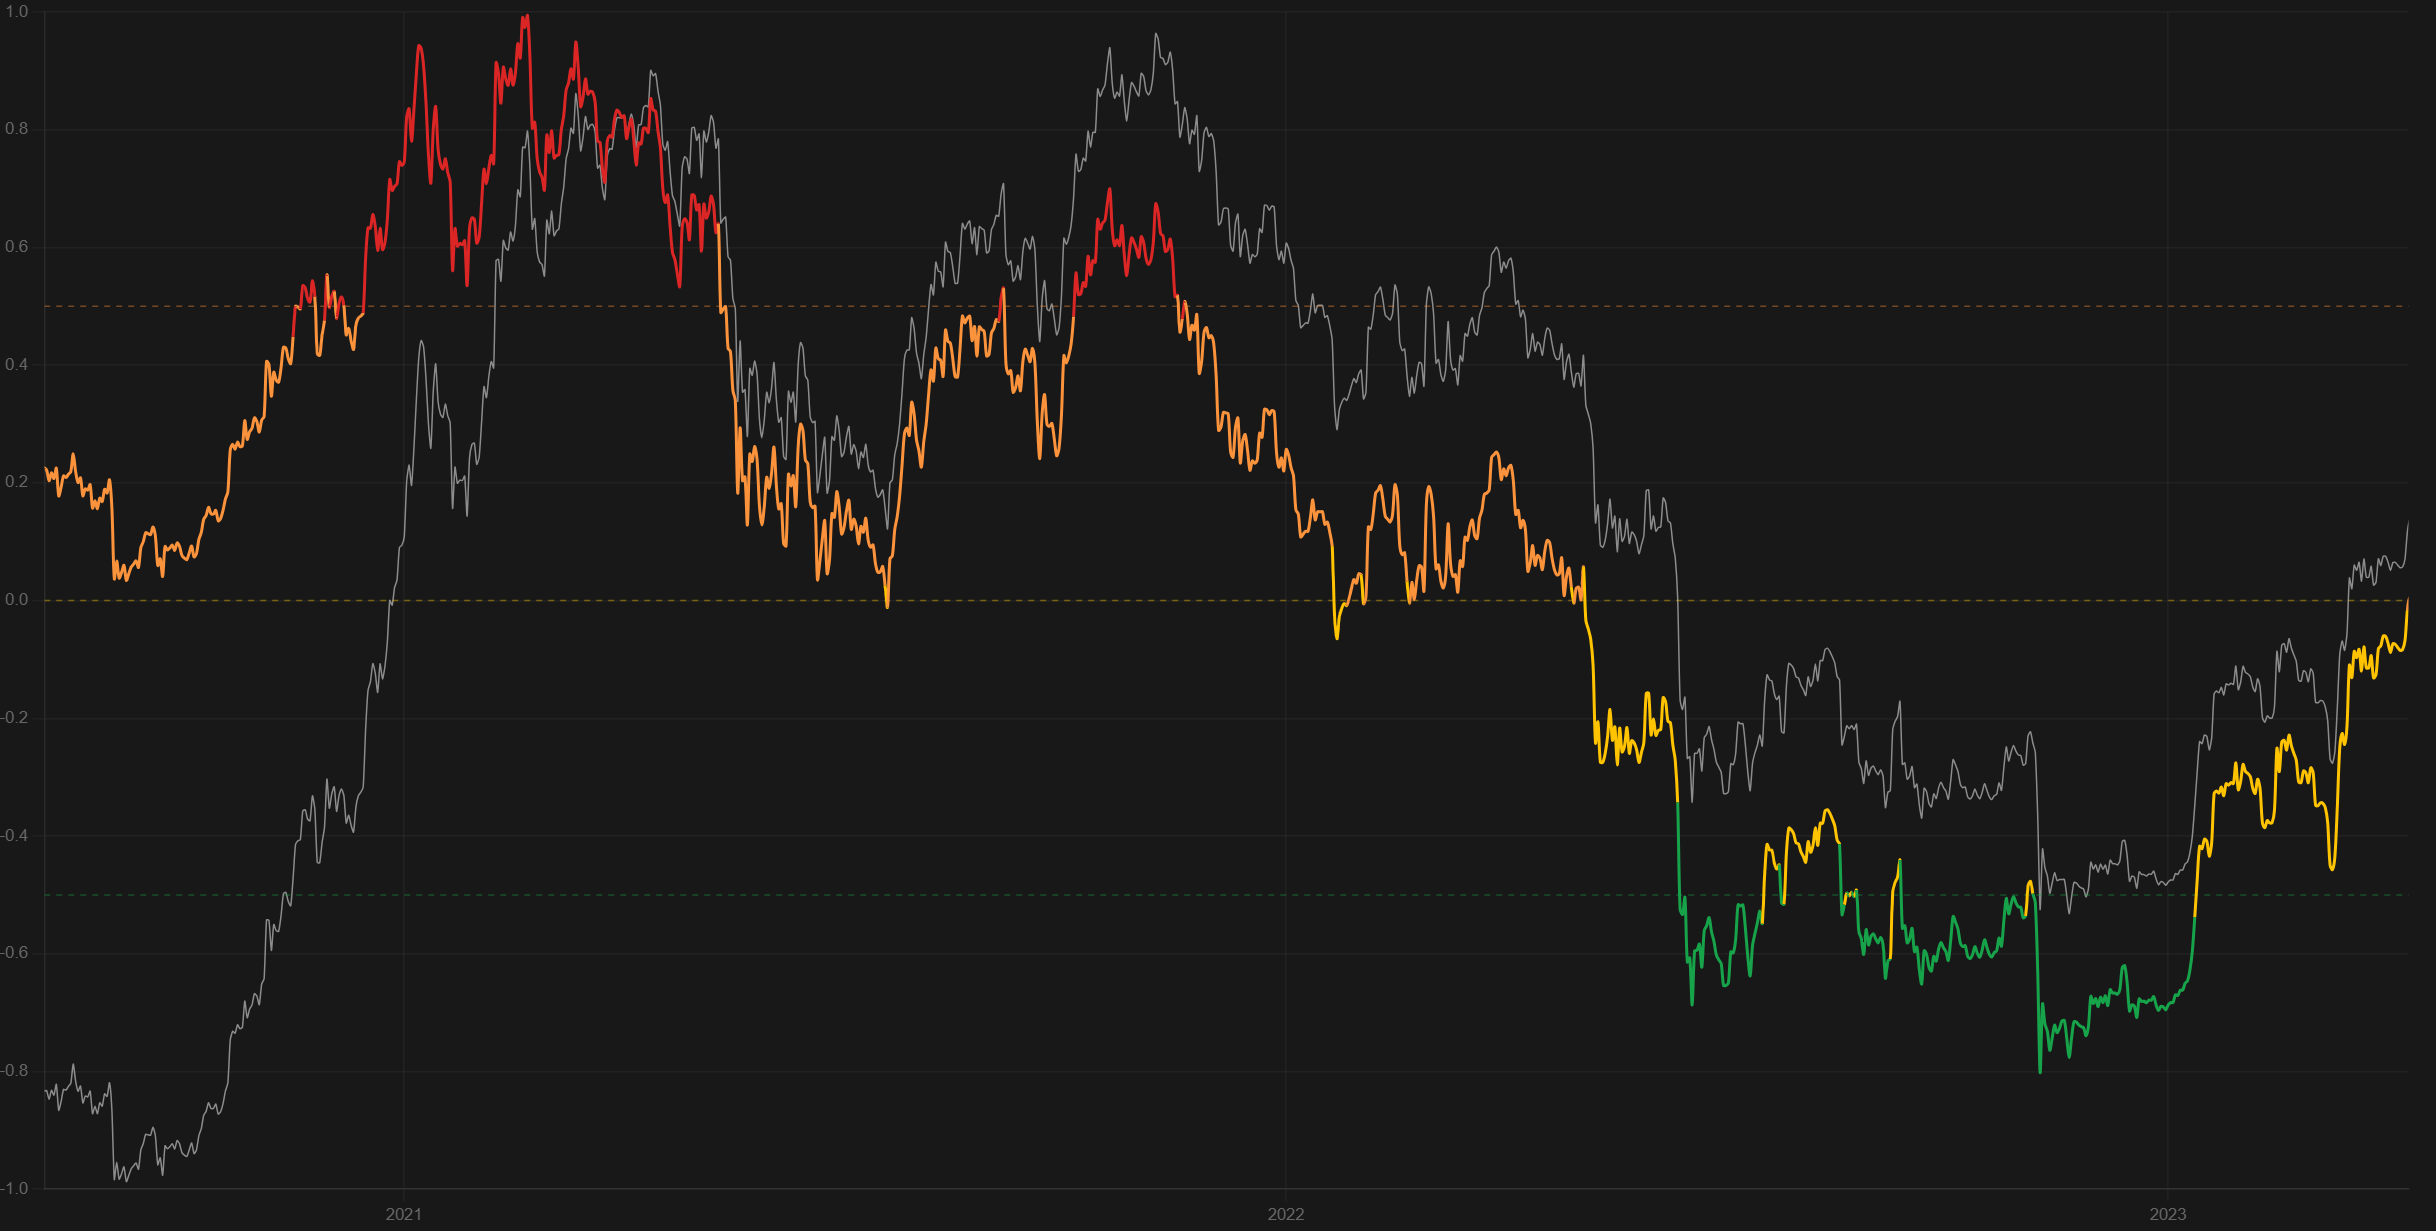
See both live readings on our Realized Oscillator page and Normalized Realized Oscillator page.
Why Both Versions Exist
The two versions represent a genuine trade-off in indicator design. Fixed thresholds (the base version) are simple, transparent, and easy to reason about — but they risk becoming stale if Bitcoin's underlying volatility genuinely shifts over a long enough timeframe, since the boundaries were set based on a specific historical window. Adaptive thresholds (the normalized version) stay responsive to a changing market by design, but sacrifice some of that simplicity — a given raw log-distance can map to a different zone today than it would have years ago, since the reference range itself has moved.
Neither approach is strictly better; they represent different philosophies that show up across several indicator pairs on this site.
Limitations
The base version can become less well-calibrated over time. If Bitcoin's typical price-to-realized-price relationship genuinely shifts as the market matures, fixed historical thresholds may not stay perfectly representative.
The normalized version's adaptivity cuts both ways. Because its range decays and expands, a reading that would have registered as extreme years ago might register as merely elevated today — which is the intended behaviour, but means the two versions won't always agree on exactly how extreme a given moment is.
Both inherit realized price's known blind spots. Like every indicator built on realized price, permanently lost coins introduce a gradual distortion to the underlying cost-basis estimate.
How to Use Them
Using both versions together is genuinely informative: broad agreement between the fixed-threshold and adaptive-threshold readings adds confidence: agreement suggests the signal is robust regardless of methodology. Meaningful disagreement is itself informative — it can flag exactly the kind of regime shift the normalized version is designed to catch. Pair either with MVRV Z-Score or NUPL, which measure related but not identical aspects of the same underlying realized-price relationship.
The normalized version is also one of the 21 inputs to our Cycle Compass composite score.
For a broader tour of the other major indicators worth knowing, see our guide to 10 On-Chain Bitcoin Indicators Every Investor Should Know.